

- Home
- Upcoming Live Training Sessions!!
- Webinar Recordings
- Implementation Courses
- Getting Started Guide For Admins
- RedTeam Go Navigation
- Gear Icon
- Administration
- Contacts
- Projects
- Planroom
- Estimate (Base Bid)
- Bid Invitations
- Proposal Package
- Construction Buy Out
- Contracts
- Daily Logs
- Photos
- Billing
- Schedules
- Submittals
- Transmittals
- Request For Information (RFI)
- Potential Change Orders (PCOs)
- Change Orders
- Owner Change Orders
- Subcontractor Change Orders
- Internal Change Orders
- Meetings
- How Do I Add Meetings?
- Close Out
- Job Costs (Purchase Orders & Expenses)
- Required Documents
- Accounting
- Reports
- Superintendent
- Subcontractor
- Architect
- Owner
- Mobile
- Release Notes
- Glossary of Terms
- Accounting
Hello. How can we help you?
What is shown on the Job Cost Statement?
Job Cost Statement is a higher-level interactive report that is designed to provide a better Over/Under view of Cost to Revenue on a project. While other In Progress reports display Committed Costs in a manner that meets the needs of Project Managers, this report is designed to more closely match the way Accounting teams track project revenue against project expense.
For clients with a QuickBooks Desktop (QBD) or QuickBooks Online (QBO) RedTeam Go Accounting integration, the report uses Push-Pull of transactions to provide the most accurate up to date information.
The numbers from the Job Cost Statement feed into the calculations that that are included in the Work In Process (WIP) report which is a company level report available to Accountants and Executives.
You can access the Project’s Job Cost Statement under Commitments in the left hand navigation or from Reports under the Accounting Budgets section of the right-hand column.
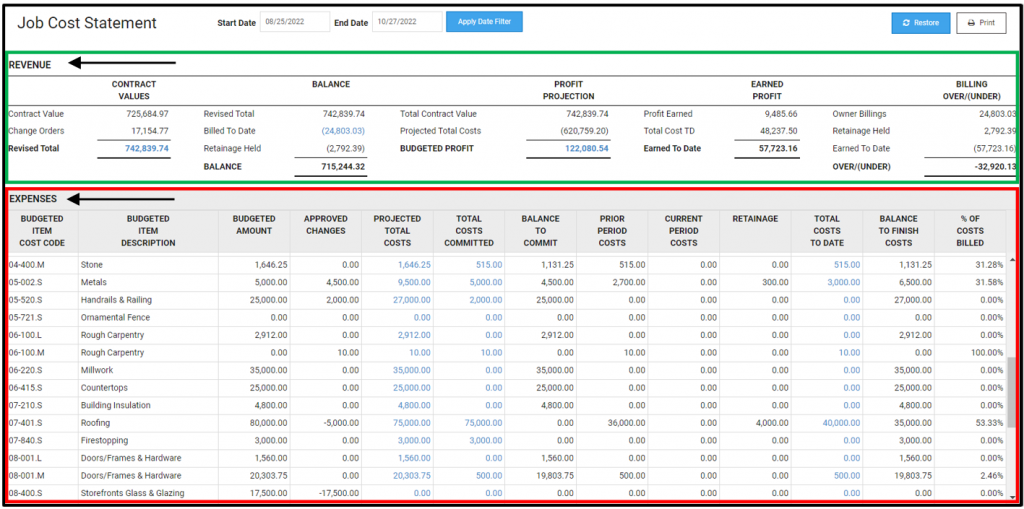
The report displays Revenue metrics on the top (highlighted in Green Box) and Expenses below by cost items (highlighted in Red Box)
REVENUE
HINT: Any value displayed in parenthesis (7,409.63) in the REVENUE section means that this value is being subtracted from the other values. In other words, it is being used as a negative value to reach the total value in the section.
Each section in Revenue builds on the calculations of the previous sections from left to right.
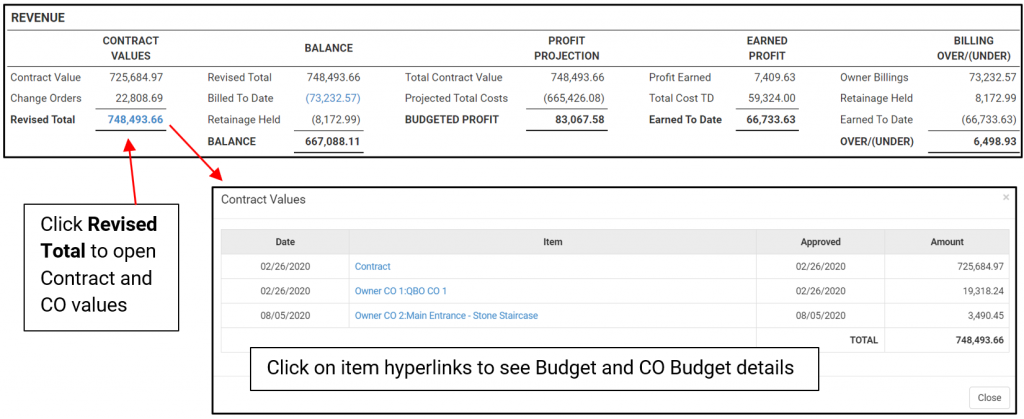
Contract Values section will show Original Contract and any approved Owner Change Orders. Click hyperlinks to show details.
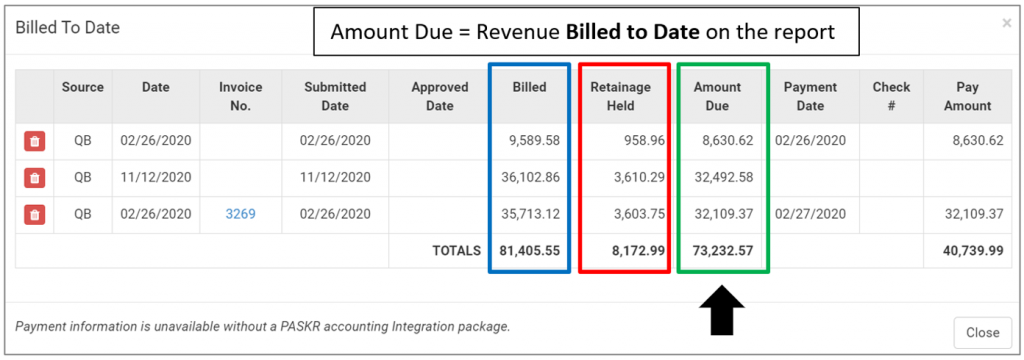
Balance will show take the Revised Total contract value and subtracts the Billed to Date Revenue portion (Owner Billing invoice totals – Retainage held by the Owner). Then the Retainage Held is also subtracted to show the remaining balance still to be billed to the Owner.
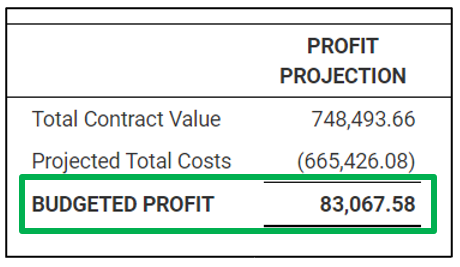
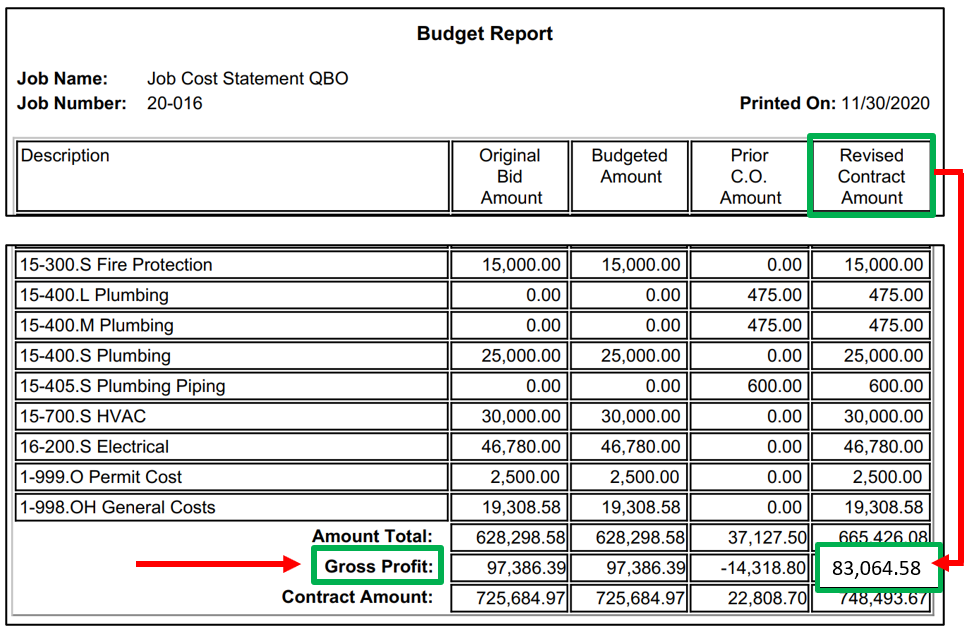
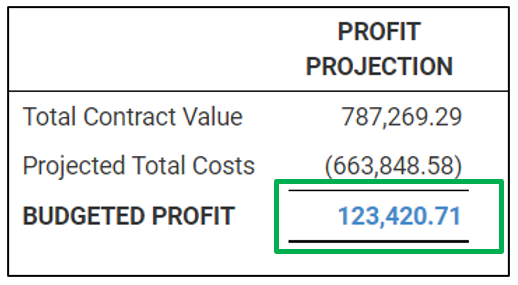
Profit Projection Compares the Total Contract Value against Projected Total Costs column of the Report to display the projected or Budgeted Profit
The Budgeted Profit will match your Gross Profit on the RedTeam Go Budget Report.
How does this differ from the Earned Profit?
- The Projected Column will display the amounts that is in each cost code (during selected filter dates)
- Labor, Material, Equipment, Other and Over Head items will show the total amount in the cost code as the forecasted amount you will spend NOT the Current amount spent (the values SPENT will show in the Cost to Date column)
- Subcontractor Cost items will show the amount budgeted
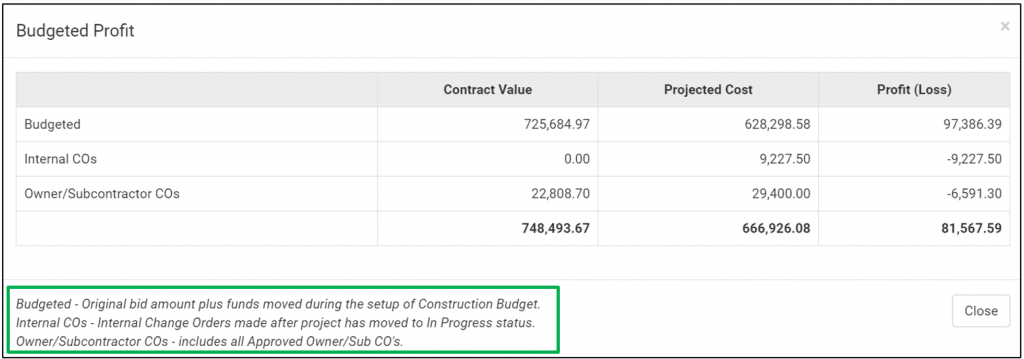
The Budgeted Profit hyperlink will open to display additional Information on the the Projected Profit/Loss. It breaks out the Budgeted Amount (original Bid Amount plus any changes made to Profit when setting up Construction Budget in WSS) as well as any profit/loss as a result of any Internal Change Order or Owner/Subcontractor Change Order transactions.
Earned Profit shows the Profit Earned (Total % of Costs Billed x Budgeted Profit) plus the Total Cost To Date to create the Earned to Date value used in the final Billing Over/(Under) Section
HINT: Moving funds that will not be spent out of cost codes via Internal Change Order will increase Earned Profit on JCS by reducing your Projected Total Costs.
Billing Over/(Under) This section will show if you have billed the Project Owner for the costs you have incurred on the project. A positive Over value shows that you have billed more than you have paid out, while (Negative) Under value means your costs have exceeded what you have billed the Owner so far. This is a benchmark to check before you create the next Owner bill to be certain to remain ahead of your expenses.
How does this section calculate? See Image and Explanation below:
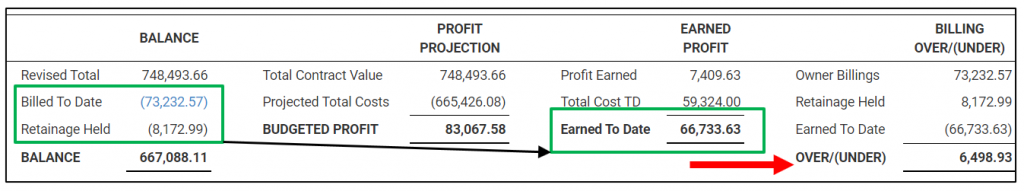
It takes the current Billed to Date amount in as Owner Billing Revenue number (which represent the Payments due to the GC) less the Retainage Held currently by the Owner, less Earned to Date total (the Profit Earned plus Costs to Date) to give the Over/(Under) value.
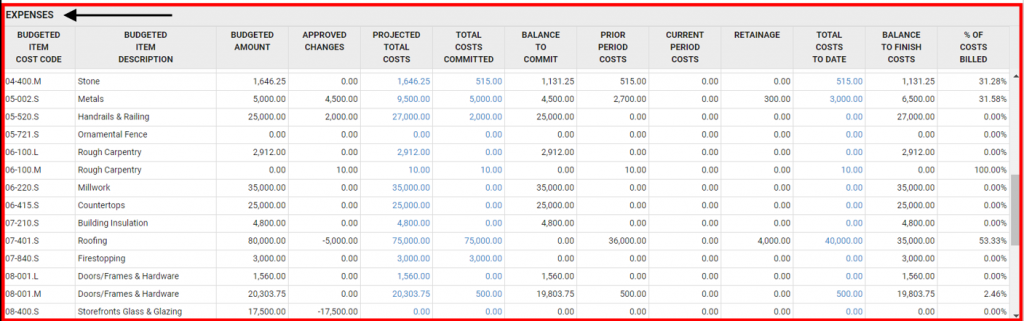
EXPENSES
HINT: Everything below EXPENSES is all about Project Cost. It displays the originally Budgeted amounts by Cost Code, Current Projected Costs, and Committed Costs. Last two columns show what remains to be spent/billed and a percentage to show if you are over or under on Budgeted costs.
WARNING! If you have a Quick Book Integration using the Job Cost Push/Pull functionality the report will behave differently. Please also refer to the following post to learn the Push/Pull works How does the Job Cost Statement work with QuickBooks Integration?
Below is a description of what each Expense column represents:
1.) BUDGETED AMOUNT – This represents the original amount allocated to the cost code without any mark ups included. This budget is set under Commitments>Budget when the project is in the Will Start Soon Status. (This column will match the Budget Report “Budgeted Amount” column).
2.) APPROVED CHANGES – Approved changes will include amounts from the “Sub Price Box” in an Owner Change Orders, Sub Only Change Order Amounts, and Internal Change Orders used to move funds in and out of Cost Items.
3.) PROJECTED TOTAL COSTS – (Columns 1 + 2 = 3) Budgeted Amount + Change Orders = Projected Total Costs. Click on the hyperlink to see the transactions that contributed to the projection.
4.) TOTAL COST COMMITTED – Committed Costs will include locked Subcontract and Approved Sub Change Order (SCO) amounts , Approved Purchase Orders, Accepted Expenses/Field Purchase Orders, and Approved Labor Costs.
5.) BALANCE TO COMMIT – Balance to commit will display the remaining funds to be spent for the cost item. NOTE: this will not apply to locked .S cost codes, since no additional funds can remain in an awarded Subcontractor cost code.
6.) PRIOR PERIOD COSTS – Cost from the previous billing periods (monthly) are automatically moved to the Prior Period Costs.
7.) CURRENT PERIOD COSTS – The costs that have accrued during the current billing period.
8.) RETAINAGE – This column will only populate for .S (Subcontractor) Cost Items that have Approved Subcontractor Bills. More detailed retainage can be seen in Sub Bill details in the Total Cost to Date column hyperlink.
9.) TOTAL COSTS TO DATE – This column will display all the transactions that were used to reach the total cost. Transactions that will be included here are Sub Billing, Purchase Orders, Field Purchase Orders, Expenses and Labor Costs (from Timesheets)
10.) BALANCE TO FINISH COSTS – The remainder of the Projected cost that has not been spent/billed. At the close of the project use negative Internal Change Orders to move unspent funds out of cost code and into Profit. If you have .S cost codes that were never awarded to subcontractors, go to the Award Subcontractors page and reduce those values to 0.00 and Save to move to Profit.
11.) % OF COSTS BILLED – This will show you at a glance if you are over or under expenses on a cost code. Anything less that 100% means there are still funds in the cost code to spend (or to be billed by Subs for awarded .S cost codes). Anything over 100% means you spent more than Projected.